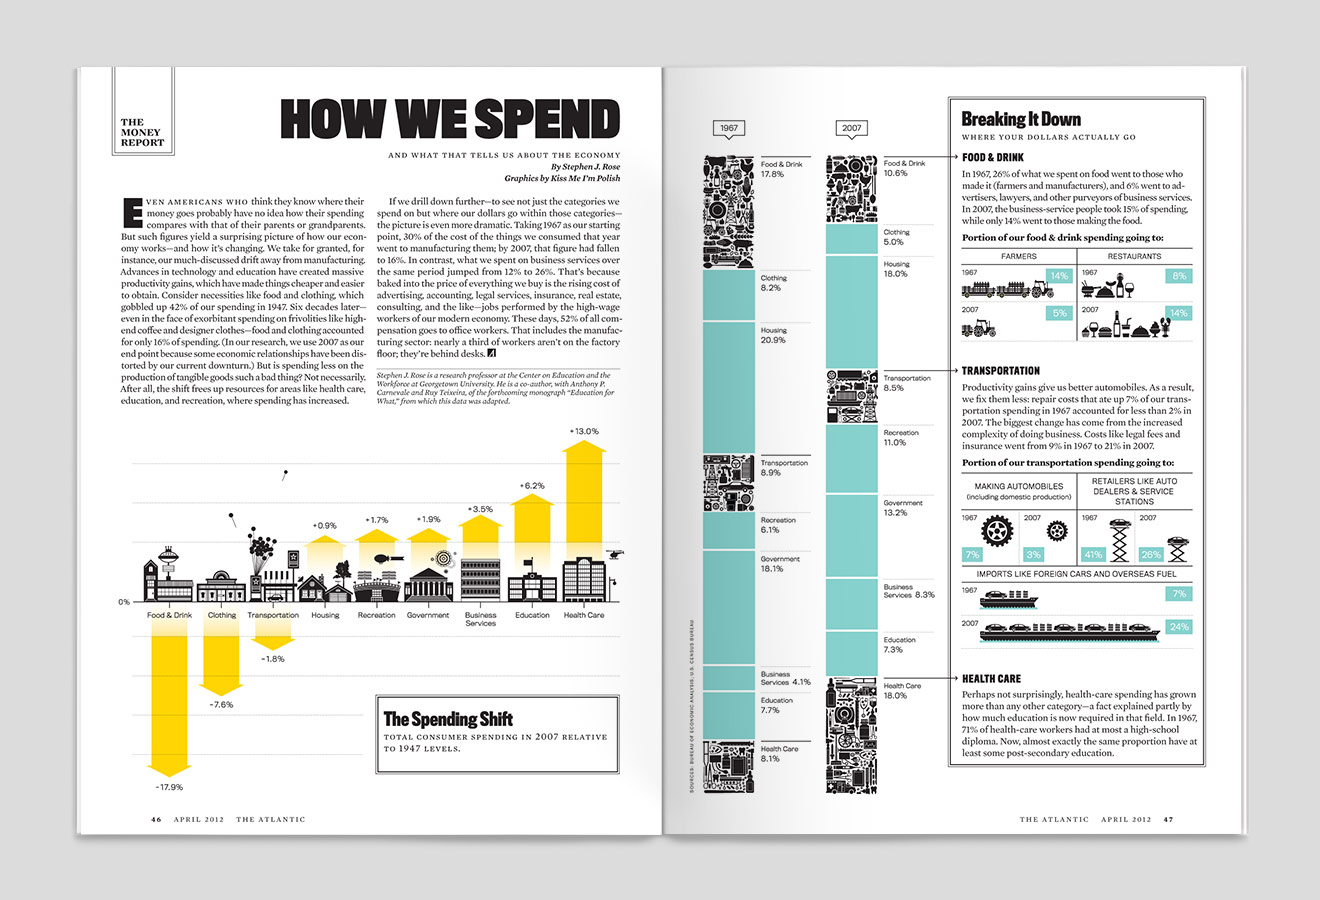
The April issue of The Atlantic is now on newsstands, and features a full spread information graphic by yours truly. The illustration, which accompanies the article “How We Spend,” presents the shift in American spending from 1947 to 1967 to 2007 within nine different categories. We made sure to blast the data with a good shot of playfulness – so pick up an issue to get a closer peek. We’re sure you’ll find something in there to tickle your fancy. In the meantime, check out the interactive version on The Atlantic website.